Real-Time Environmental Risk Mitigation: Monitoring via the Home Radon Monitor
November 15, 2026
No Comments
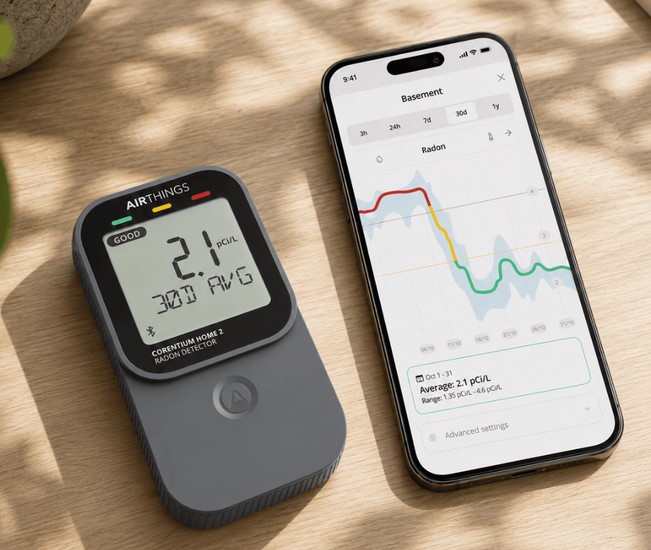
Source:https://www.airthings.com
A few years ago, I walked through a pristine basement renovation with a client who had spared no expense. They had installed custom cabinetry, high-end vinyl plank flooring, and a sleek home theater setup. Yet, when I asked if they had tested the air quality beneath that beautiful subfloor, they looked at me blankly.
We deployed a continuous digital sensor that afternoon, and within 48 hours, the screen flashed a grim reading: 9.2 picocuries per liter (pCi/L)—more than double the EPA’s action threshold. The homeowner was stunned because the air smelled completely fresh and looked crystal clear.
According to the U.S. Environmental Protection Agency (EPA), radon gas is the leading cause of lung cancer among non-smokers, claiming over 21,000 lives annually in the United States alone. Installing an accurate home radon monitor bridges the gap between invisible soil gas infiltration and real-time environmental risk mitigation, allowing you to protect your family before a silent health hazard takes hold.
The Silent Soil Gas: Why Legacy Charcoal Tests Fall Short
Radon ($^{222}\text{Rn}$) is a naturally occurring radioactive gas formed by the decay of trace uranium in soil, granite, and bedrock. Because it is odorless, colorless, and tasteless, it migrates upward through foundation cracks, sump basins, construction joints, and utility penetrations without leaving any physical visual footprint.
For decades, homeowners relied strictly on passive charcoal test canisters mailed to third-party laboratories. While useful for a basic snapshot, charcoal tests fail to capture real-time environmental dynamics.
Deploying a digital home radon monitor provides dynamic tracking across changing seasons, weather fronts, and ventilation patterns.
+-----------------------------------------------------------------------+
|                    RADON MONITORING METHOD COMPARISON                 |
+--------------------------+---------------------+----------------------+
| Feature / Metric         | Charcoal Canister   | Digital Home Radon   |
+--------------------------+---------------------+----------------------+
| Data Timeliness          | 3 – 7 Days (Delayed)| Continuous / Real-Time|
| Fluctuation Visibility   | Static Average Only | Hourly / Daily Graphs|
| Reusability              | Single-Use Only     | Lifetime Continuous  |
| Seasonal Tracking        | Poor                | Exceptional          |
| Actionable Intelligence  | Low                 | High (Immediate Alerts|
+--------------------------+---------------------+----------------------+
Think of a single-use charcoal canister like taking a single digital photograph of a highway—it shows you one split second, but misses the traffic jams before and after. A digital continuous monitor acts like a 24/7 security camera, streaming live footage of fluctuations as atmospheric pressure shifts.
Physics of Radon Infiltration: Stack Effect and Pressure Gradients
To understand why radon levels spike unpredictably, we must look at how air moves through a residential building envelope. Heated air inside your living space rises toward upper levels and exhausts through attic vents—a natural physical process known as the stack effect.
This upward thermal air movement creates a negative pressure differential at the basement or crawlspace floor slab, literally pulling radioactive soil gas out of the earth like a soda through a straw.
                      ROOF VENTS / ATTIC
                              |
                     ( Warm Air Exhausts )
                              ^
                              |
                     [ LIVING QUARTERS ]
                              ^
                              |
                   ( Negative Pressure Vacuum )
                              ^
                              |
     =================================================== [ CONCRETE SLAB ]
           ^                  ^                  ^
     [ Slab Crack ]    [ Sump Pit ]     [ Utility Pipe ]
           |                  |                  |
     --------------------------------------------------- [ SOIL / BEDROCK ]
                 ( Radon Gas Infiltration )
During winter months, when indoor heating runs continuously and windows remain sealed tight, soil gas suction peaks. Rainstorms and dropping barometric pressure further accelerate radon expulsion from soil pores into your foundation cavities.
Technical Specifications: Sensor Tech and Measurement Units
When shopping for continuous environmental sensors, understanding internal detection mechanics ensures you select a reliable unit with commercial-grade accuracy.
Sensor Mechanics
-
Pulsed Ionization Chambers: High-precision sensors that measure electrical current pulses generated when alpha particles strip electrons from gas molecules inside a sealed chamber.
-
Pillar Photodiode Sensors: Compact solid-state semiconductor sensors that detect light energy released during radioactive decay events.
Measurement Metrics & Safety Thresholds
Radon concentration in North America is measured in picocuries per liter of air (pCi/L), whereas international health standards use Becquerels per cubic meter ($\text{Bq/m}^3$) ($1\text{ pCi/L} \approx 37\text{ Bq/m}^3$).
-
Below 2.0 pCi/L: Target baseline indoor air level; minimal health risk.
-
2.0 to 3.9 pCi/L: Moderate risk zone; consider mitigation if levels persist year-round.
-
4.0 pCi/L and Above: EPA Action Level; structural mitigation (such as an Active Soil Depressurization system) is strongly recommended.
Step-by-Step Blueprint: Deploying Your Home Radon Monitor
Installing a digital home radon monitor requires strategic placement to ensure data accuracy and avoid false high or low readings.
       [ STEP 1 ]             [ STEP 2 ]             [ STEP 3 ]             [ STEP 4 ]
+----------------------+   +--------------+   +----------------------+   +----------------------+
| Target Location      |-->| Elevation &  |-->| Baseline Sensor      |-->| Long-Term Trend      |
| Selection            |   | Boundary Clearance| Initial Calibration  |  | Analysis & Action    |
+----------------------+   +--------------+   +----------------------+   +----------------------+
Step 1: Identifying the Target Placement Zone
Place your monitor in the lowest regularly occupied level of your home—typically a basement bedroom, home office, or ground-floor family room. Do not place the unit in unconditioned crawlspaces, laundry rooms, or utility closets.
Step 2: Maintaining Boundary Clearance
To prevent air turbulence from warping sensor readings:
-
Elevate the device 2 to 3 feet off the floor on a table, shelf, or nightstand.
-
Keep the sensor at least 3 feet away from exterior doors and windows.
-
Position the unit away from direct sunlight, heating vents, humidifiers, and exterior wall drafts.
Step 3: Initial Sensor Calibration Phase
Once powered on, digital sensors require an initial stabilization window. Allow the unit to sit undisturbed for at least 24 to 48 hours to establish a reliable baseline reading.
Expert Advice: Pro Tips and Hidden Warnings
Over a decade of evaluating indoor air quality and structural performance has shown me that misinterpreting sensor data leads to unnecessary panic or dangerous negligence.
Hidden Warning: Never base an expensive structural mitigation decision on a single 24-hour spike! Radon levels fluctuate wildly during heavy rainstorms or rapid temperature drops. Always evaluate the long-term average (30 to 90 days) before investing in sub-slab depressurization systems.
Keep these operational guidelines in mind to maximize data integrity:
-
Audit Seasonal Shifts: Monitor continuously through winter and summer cycles. A home that reads a safe 1.8 pCi/L in July may easily climb past 6.0 pCi/L in January under closed-house conditions.
-
Re-Test After Structural Renovations: Sealing basement floors, finishing walls, or installing new HVAC ductwork changes internal pressure dynamics. Always track levels for 30 days after major home improvement projects.
-
Pair with Smart Home Automation: Select a smart radon monitor equipped with Wi-Fi or Bluetooth connectivity. Linking sensor alerts to smart ventilation systems or ERVs (Energy Recovery Ventilators) allows automated fresh-air dilution when spikes occur.
Troubleshooting Environmental Data and Sensor Variance
If your digital monitor displays unexpected readings or connectivity issues, consult this quick reference matrix to isolate the cause.
+---------------------------------------------------------------------------------+
|                        RADON MONITOR TROUBLESHOOTING GUIDE                      |
+----------------------+--------------------------+-------------------------------+
| Symptom Observed     | Underlying Cause         | Recommended Corrective Action |
+----------------------+--------------------------+-------------------------------+
| Sudden High Spike    | Heavy Rainstorm / Rapid  | Wait 48 hours for barometric  |
|                      | Pressure Drop            | pressure to balance out       |
| Unusually Low Read   | Placement Near Draft /   | Move monitor away from vents, |
|                      | HVAC Supply Vent         | open windows, and fans        |
| Erratic / Zero Reading Sensor Contamination /   | Reset device power; clear dust|
|                      | Low Battery Voltage      | grilles using compressed air  |
| App Offline          | 2.4 GHz Wi-Fi Dropout    | Re-pair device to 2.4 GHz band|
|                      |                          | or reset gateway module       |
+----------------------+--------------------------+-------------------------------+
When evaluating radon levels post-mitigation, ensure your active mitigation fan runs continuously. If your digital monitor shows levels creeping back toward 4.0 pCi/L, inspect your exterior exhaust pipe for ice blockages or check the fan manometer for pressure drops.
Take Charge of Your Indoor Air Quality
Investing in an accurate home radon monitor transforms an invisible, dangerous environmental threat into actionable real-time data. By understanding pressure dynamics, placing sensors correctly, and tracking long-term trends, you gain total peace of mind and protect your family’s long-term health.
Have you ever tested your home for radon gas, or are you currently setting up a smart air quality monitor in your basement? Drop your questions, reading averages, or project ideas in the comments below—I’d love to help you build a safer home!